
| About Investment Portfolio Optimization |
| Asset Allocation Primer Page | Download an Old Investment and Portfolio Optimization Terms Defined Tutorial | About Monte Carlo Simulators | About Model Portfolios Created by Portfolio Optimizers |
| Site Information (is listed below. The financial planning software modules for sale are on the right-side column) Confused? It Makes More Sense if You Start at the Home Page How to Buy Investment Software New Financial Planner Starter Kit Professional Investment Portfolio Building Kit Financial Planning Software Support Financial Planner Software Updates Site Information, Ordering Security, Privacy, FAQs Questions about Personal Finance Software? Call (707) 996-9664 or Send E-mail to support@toolsformoney.com Free Downloads and Money Tools Free Sample Comprehensive Financial Plans Free Money Software Downloads, Tutorials, Primers, Freebies, Investing Tips, and Other Resources List of Free Financial Planning Software Demos Selected Links to Other Relevant Money Websites
|
What an investment portfolio's efficient frontier is, what a portfolio optimizer is, what it does, how, and why it's not neededFirst, a Summary: Portfolio optimization is asset allocation. The investment software used is called a portfolio optimizer. It generates a chart called the efficient frontier. The efficient frontier is just a line made up of dots (around 100 on average. See the image below). The bottom X axis of the chart is the historical rate of return of the portfolios (returns increase as you move to the right). The vertical Y axis is risk as measured by standard deviation (risk increases as you go up). So the efficient frontier usually slopes upward, because returns generally increase as one assumes more risk. Each dot is just a plot data point telling what the investment portfolio's risk and rate of return was over the selected time frame, and how much of each investment was assumed to be held. So each dot on the line is one "efficient optimized portfolio" comprised of a unique mix of the investments one allowed the optimizer to use When you go up the efficient frontier to the next dot (toward the top right corner), it will have slightly more risky investments and slightly less conservative investments. Vice versa, when you go to the next dot down, you get an optimized portfolio with slightly less return and less risk.
Asset allocation is the art and science of spreading money around between different types of investment asset classes to stabilize and increase returns and lower volatility and risk through diversification. This is also known as optimizing an investment portfolio, thereby making it more efficient. Portfolio optimization just quantifies how much risk and return an investment portfolio's asset allocation mix has had over one past time horizon. So in a nutshell, all portfolio optimization does is refine and quantify the risk and return characteristics of a certain mix of investment assets (or asset classes) over a past time frame. Without portfolio optimization, you're just slapping a few asset classes together and saying that you've reduced risk via diversification. Portfolio optimization quantifies how much in numbers. It tells you how much risk you've reduced, and how much return you've gained (or failed to lose), by using asset allocation strategies. The goal is typically to find the portfolio with the asset allocation mix that is the furthest "Northwest." The dot that's closest to the top left corner is the portfolio that is the most efficient. In other words, of all of the investments input into the optimizer, it's the mix that has had the most return per unit of risk over the selected time frame. This is why some investment firms are called names like, "Northwest Quadrant." They're trying to tell prospects that they get good returns with low risk for their clients. The first section of this page below goes into the details of why it's so cool, and the last section tells why it's all not as cool as all that. In summary, it doesn't work well because as soon as one slightly changes the time frame, you get a whole different mix of investments. This huge amount of difference makes it obvious that even the most efficient portfolio possible should be taken with a huge grain of salt. Then when this efficient portfolio actually is implemented in the Real World, the results going forward are usually nowhere as efficient at the optimizer said it would be. It's extremely fascinating, but basically doesn't work. Therefore, it's not useful because it has little-to-no predictive ability. This is why hardly anyone uses portfolio optimizers in the Real World to manage money (and also why it's rarely written about in the press). If it actually worked, then you'd be reading about it all of the time in press articles for normal people (in contrast to readers of the CFA's arcane magazine). Investment advisers that do use them, and whom are fascinated by them, usually have less than 500 hours of experience using them (e.g., using an optimizer an average of two hours a day in a 40-hour work week for one-year). After 1,000 hours, one has it down about as well as possible. It's only after about 5,000 hours does one realize the reality of the situation. Mike, our portfolio manager, has over 10,000 hours of very hard labor using just about every type of portfolio optimizer ever sold (up until mid-2003). The bottom-line here, is that if you're still in the, "Wow, this is soooo cool!" stage, then still you're in the place commonly known as, "You know just enough to be dangerous." So heeding the warnings on this page may literally save your life (because they are wild animals, and are very dangerous).
Now the Details: Portfolio optimization is the heart of what's called "Modern Portfolio Theory," or MPT. Lame joke: if you still feel "empty" after understanding MPT, then join the club. For decades, MPT has guided investment managers responsible for trillions of dollars of pension funds, endowment funds, and other institutional portfolios around the world. MPT helps enable investors to maximize their returns and achieve their financial objectives - all while minimizing both risk and investment expenses (which allows you to sleep and take vacations). In a nutshell, portfolio optimization picks up where the asset allocation process leaves off. It basically refines an asset allocation once it�s established, and allows risk and return to be quantified, which then allows it to be compared and backtested against other things. The purpose, and the whole gist of MPT, is to include investments in portfolios that have good returns while providing various diversification benefits. This reduces risk and volatility without sacrificing returns (much). Diversification is a good thing, and prevents problems associated with "having all of your eggs in one basket." But too much diversification can dilute investment performance because you'll have less of what's going up than you would like, so there is always a trade-off. The combination of asset allocation and using an optimizer to optimize that asset allocation is an effective way to get the desired balance of diversification that fits clients' lives. It is the state of the art, and nobody has come up with anything that works better over the last seventy years. MPT is not really very modern at all. Mathematician Harry Markowitz, currently retired, won the Nobel Prize for this seminal work in the 1950's. William Sharpe, a Stanford professor, then took the complex math of Markowitz's work and distilled it into a practical and useable form that runs on PCs in the 1980's. He then won the 1990 Nobel Memorial Prize for Economic Science for this work. Yes, Modern Portfolio Theory and asset allocation still works, even considering the debacle of 2008 - 2009. Also, asset allocation in general "didn't work" in 2011 either, as you can read about here. Also, life as we know it almost ended in January 2009, so EVERY market and asset class went down for a few months after that. Then the 2011 crash was also an anomaly caused by way too many people day-trading ETFs. The press is just starved for anything remotely interesting to write about when it comes to general investing, so that's why claims of MPT being dead popped up like Whac-a-moles in 2009 through 2012. The best advice we can give on this is to just ignore all of that nonsense.
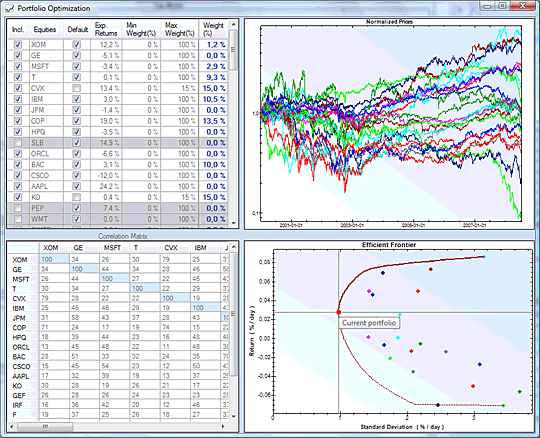
Back to why portfolio optimization strategies are so cool (written in 2003): So What is Investment Portfolio Optimization Anyway? The following is a summary on the workings of optimizers that work at the actual asset level. In other words, it works with the historical monthly returns of actual stocks, mutual funds, and other investments that real clients can actually own. Most optimizers work only at the asset class level, such as cash, bonds, growth stocks, and international stocks. The following discussion does not apply to lower-end optimizers that only work at the asset class level. Most of this is about "real portfolio optimizers," that work at the asset level. We feel asset class optimizers are even more dangerous than real optimizers, and should be avoided when it comes to creating investment portfolios in the Real World (it's fine for a college student to use them in their studies and other empirical work). The optimization process is the "rocket science" of the investment management business. Basically the optimizer's job is to find the combination of investments (in the whole portfolio) that have demonstrated the least risk given a rate of return, or the maximum rate of return given a fixed amount of risk. This is not an exact science and there is no crystal ball, so optimization just gets you as close as computers and historical data can take you. An optimizer is just a computer program that uses three sets of monthly historical data collected on each individual asset, all using the same time horizon. An individual investment would be an actual mutual fund or stock. These three sets of data are: • Risk as measured by monthly standard deviation(s). Even after decades of investment and computer revolutions, standard deviation is still just about the only way a computer can understand investment risk. • Rate of return (as measured by total return - which includes yield). • The monthly covariances the investment had relative to other investments input. The covariance numbers tell the computer how much an investment�s market value increased or decreased relative to the other investments over the same time frame. For example, if oil prices rise substantially over a given time frame, then one would expect that airline stocks (which have fuel made from oil as their main expense) would decline in value. If airline stocks actually fell and oil stocks actually rose during this time frame, this would be called negative covariance between the two. It's also called negative correlation, but the differences are minor. Negative covariance is rare, and it's not needed to reduce risk. As long as adding an investment to the other investments lowers overall portfolio risk, without noticeably lowering the overall rate of return too much, there is a diversification benefit. The portfolio optimizer tells you if this happened, with all of the numbers needed to analyze, decide, and then make it so in the Real World. The whole point in optimizing is to find the mix of investments that when combined has had the most return for the least amount of risk to the portfolio as a whole. This happens by finding and combining investments without high covariance so when one investment class goes down, others don't follow it down as much as they might have otherwise without optimizing. This reduces risk because at any point in time, some asset classes may be performing badly, while others may be doing well. The opposite condition could also take place at any time. Managing risk is important because nobody can predict with certainty when investments will need to be sold to raise money to spend. Since nobody can predict these things, the risk is that something may need to be sold while it is (temporarily) down in value. Once an investment is sold, and the money spent, the loss cannot be made up again (in contrast to reinvesting the sale proceeds into another investment). Just "paper losses" are real when life actually happens. Managing risk is also important for the basic fact that clients don't like it when they get their monthly statements and they have less money than they had the month before. Investment managers also don't like answering client calls when their portfolio is down. Having to tell a client the portfolio's return when it's down is the #1 reason why advisers get fired. They tend to call their advisors and ask them why, even when the press has been consistently reporting a down market. Nobody likes this, so it works to everyone's advantage to minimize it as much as possible. Minimizing risk also works well in Model Portfolios because it's usually what advisors show prospects when they ask to see some historical track record. Showing prospects that a Model Portfolio is up for the year, while the market is down, is a great bottom-line for a long boring story. If this Has Been Around for So Long, Why Haven't I Heard of it Before? You haven't heard about this before because advisers, the press, and the commission-based industry don't want you to know. They don�t want you to know because this is an area that they know they can't compete in. The media doesn't report on asset allocation because it's too boring. They only like advisers with hot stock / ETF picks and market timers, because that gets their ratings up. They also don't know how to write about it well, because the terminology is too arcane, so they're afraid of getting things all wrong and having to print retractions. It's also a source of controversy from rookie brokers to Ivy League college professors. The main controversy stems from the fact that the input data the optimizer uses is "historical data." In other words, the only thing the computer has to work with are price changes from investments that happened in the past. So the obvious question is, how well does this process predict rates of return, risk, and covariance into future? We'll summarize many books, articles, and years of study and experience here: The optimization process is completely meaningless in predicting future rates of return. The rates of return shown for investments in the reports are based on historical data and statistical confidence levels. Absolutely nobody knows, and no firm, university, nor computer program can predict what the rate of return will be on any non-fixed investment. An example of a "fixed investment" would be a CD because you know what interest rate you will get and you always sort of know what you'll get back if you cash it out early or wait until it matures. Everything that doesn't have rate of return set in stone when you buy it is a non-fixed, or a "variable" investment. Predicting rates of return on non-fixed / variable investments just can't be done, and anyone who says it can is, as they say, "either a liar or a fool." The optimization process is good at predicting risk into the future. Risk is being measured by standard deviation of monthly returns. Standard deviation is a statistical summary that illustrates the chance of an investment's price moving up or down by so much compared to the investment's average price, over a one-year period. This is still the only way computers understand investment risk. Empirical evidence shows that most investments exhibit similar risk characteristics over time. In other words, a stock's price volatility (how much it goes up or down relative to its average price) is, on average, about the same year after year. Being able to predict the risk on investments that you can actually own is very important - even if it's just in the ballpark. The optimization process is good at predicting future covariance from past covariance, which is the main point and benefit from optimizing. In other words, oil stocks and airline stocks have moved contrary to each other for decades, and until a new source of jet fuel is found, they more than likely will continue to behave as they have in the past. Covariance between investments that you can actually own is the key to the whole concept of MPT. It is this stability over time that makes the optimizer useful in the Real World (remember that this wasn't edited since it was written in 2003). An Illustration Assume you are living on an island with tropical beaches and a high mountain with good snow in the winter. You own a mountain ski resort that returns on average 15% ±10%, every year during the winter (the ± number is the standard deviation). But in the summer it returns -5% ± 10%. To you, this is a high-risk deal because if you don't do really well in the winter, you won't be able to save enough, then you'll starve in the summer when nobody skis. On a bad year you may only see +5% in the winter and -15% in the summer, for an average loss of around 10% for the year. Now assume you want to buy another business because you don't like the risk of only being in the ski business. Assume you're only two choices are: 1) An umbrella business that returns 20% ± 15%, during the winter, and -10% ± 10% in the summer (because it rains all winter, and it never rains in the summer); or 2) A suntan lotion / sunglasses / surf shop that returns 7% ±10% during the summer, and 5% ± 2% during the winter. Without optimizing, most people would probably choose the umbrella business because it has a higher rate of return. And it does, but only in the winter. But in the summer, you'll still be taking an even greater risk of starving if things don�t work out. But without the optimizer, there's no way to know this. The optimizer will choose the lotion & surf business even though the return is lower. Why? Because the risk as measured by how much your rate of return varies month to month, when both businesses are combined (the ski-umbrella vs. the ski-lotion & surf combination), went from intolerably high with the ski-umbrella combination, to tolerable with the ski-lotion & surf business combination. You give up more potential overall return on your money by opting for the suntan business over the umbrella business. But your risk of starving if one of your businesses has a bad year has now been mostly eliminated. This is what the optimizer does. It finds the combination of investments that may produce the highest overall rate of return, with the lowest overall amount of risk. This portfolio, or combination of investments, is called an "efficient portfolio." This portfolio is just a certain mix of the investments used, represented by one dot on a line of dots. This line of many portfolios is called the efficient frontier. When you move up to the next dot, the amount of riskier investments increases, and safer investments decreases, and vice versa. The investment portfolio selected in the image below is represented by the light blue dot on the efficient frontier (the dark blue line. Note that this is not illustrating the hypothetical resort business mentioned above). The list of investments and their percentages are shown in the table at the bottom. So when you move the dot up or down, this list of numbers changes. The light blue dot represents the optimized portfolio that met the client�s guideline asset allocation targets. It also had less risk and more return than a similar index-based portfolio over the same time horizon. The red triangle represents the risk and return of the index-fund portfolio over the ten-year time horizon. This difference is very large, and would be totally miraculous if you could get it to repeat itself in the future in the Real World.
Back to the hypothetical resort business example: Keep in mind that the portfolio is only as efficient as it can be given the investments the user gave it to work with over one time frame. In this example, we only gave the computer three assets (businesses) to work with. In the Real World, we could give it over 100 to work with. Efficient portfolios are a very good thing, are worth pursuing, and come in handy - especially when the markets are very volatile, or go down and then stays flat for a long time. Basically the job of the optimizer is to find the combination of assets that have demonstrated the least risk given a set rate of return, or the maximum rate of return given a set amount of risk. It does this by using three sets of data all over the same historical time frame: risk as measured by standard deviation (s), the rate of return, and the covariance that asset (e.g., mutual fund) has relative to other assets. Standard deviation is a common statistical term used to measure how much something varies around its average value. For example, if something has an average value of 100, and this value varied between 95 and 105 about 67% of the time, the standard deviation would be five. The correlation numbers tell the computer how much the asset's market value moves relative to the other investments over the same time frame. (Correlation is the mathematical representation where covariance is scaled between 1 and -1 so computers can understand work with it.) Negative covariance is rare, but it's not needed to do the job of reducing risk. As long as adding that asset lowers overall portfolio risk, there is a diversification benefit. If the optimizer thinks adding a particular asset provides a diversification benefit, which could potentially lead to lower overall portfolio risk, without lowering the return significantly, the program will choose to use this asset at the exclusion of others. For example, if you had a portfolio with a lot of oil stocks, the optimizer would choose to add airline stocks instead of adding more oil stocks, even if the historic return of oil stocks is higher than airline stocks. The whole point of optimizing is to find the combination of assets that when combined have had the most return for the least amount of risk to the portfolio as a whole. This happens by finding and combining assets without high covariance so when one asset class goes down, others don't follow it down as much as they might have if you didn't optimize. This reduces risk because at any point in time, some asset classes will be performing badly, while others are doing well. Next year, the opposite condition could take place. So on average, risk is reduced without lowering total return very much. Nobody can predict, and almost nothing can protect from, the risks to asset classes or actual assets (such as individual stocks). Most of this desirable diversification effect happens during the asset allocation process, but the optimizer serves as the main refining tool to lower overall portfolio risk. Optimization takes diversification another step past just using asset allocation techniques alone. Important Optimizer Things to Keep in Mind The main point is to find the best combination of investments that, when combined, have shown good risk reduction while maintaining a reasonable rate of return, all while keeping all of your investment constraints in mind. In other words, the end result of the optimization process should conform to your calculated guideline asset allocation, and various constraints investors place on the portfolio (e.g., "Don't sell my Facebook!"). This is very important, and is the most overlooked point by novice users of optimization software. Most novice optimizer users let the results of the optimizer determine the asset allocation mix - which is even more inappropriate and adds even more risk than using inefficient Model Portfolios. How well does this process predict rates of return, risk, and covariance into the future? This optimization process is meaningless in predicting future rates of return. The rates of return shown in the reports are based on historical data and confidence levels. Nobody knows, and no computer program can predict, what the rate of return will be on most investments with any degree of reliability. The process is okay at predicting risk (as measured by standard deviation). Empirical evidence shows that most assets exhibit similar risk characteristics over time. The process is good at predicting future covariance between assets. This is the main point of optimizing. Here is something very important to keep in mind: The particular optimization software that we used to use works with actual assets. In other words, it worked with the actual mutual funds and stocks one may currently own. You may have seen this type of study done before, but only using generic asset classes such as growth stocks, bonds, cash, etc. In those studies, the asset class optimizer uses only groups of assets, such as bonds, to represent an actual bond mutual fund. That more generic methodology does provide some value, but in order to do this work correctly, you'll need to use the actual assets and not asset classes. A Real World large-cap growth fund has a substantially different data set (rates of returns, risks, and covariances) than the asset class as a whole, or other growth funds. This is why optimizing with generic asset classes, then substituting an actual mutual fund to represent the asset class after the work is done, is defeating the whole purpose (and usually just "doesn't work"). This would only work reasonably well if one used index funds as the actual investment vehicles (ETFs are not even index-like enough to be properly substituted here). Why Optimizing at the Asset Level is Better than the Asset Class Level Real asset level investment optimizers are several times more expensive than asset class portfolio optimizers, which is why the latter are used a lot more. Optimizing at the asset class level means the optimizer can only work with broad asset classes, like U.S. growth stocks, international stocks, etc. Optimizing at the asset level means the program works with investments people actually can own, like Fidelity Magellan mutual fund, Microsoft stock, etc. Optimizing at the asset class level is by far the most popular way to go from an advisor's point of view. This is because it's easy, cheap, and (relatively speaking) it takes hardly any time to learn and then do the work. There are numerous inexpensive software programs that make optimizing at the asset class level easy, while still looking good from a sales perspective. After optimizing at the asset class level is done, the optimal mix of asset classes is chosen, and then the advisor will select actual investments that represent those asset classes. For example, if the optimal portfolio chosen off the efficient frontier calls for 25% U.S. bonds, then the advisor will usually recommend 25% of the portfolio be placed into their favorite bond mutual fund. Keep in mind the software program has no idea of what the risk, return, and correlation properties of this exact mutual fund were. It only knows what the broad bond index, or asset class, used by the program looks like. The whole point is to use the asset class as a surrogate to represent this actual bond mutual fund. In other words, the advisor is pretending the U.S. bond asset class is the actual bond mutual fund the advisor wants to use in the portfolio. That's why we call asset class optimization, "pretend optimization." If only no-load index mutual funds that closely represent the generic asset classes were used, then this problem wouldn't be significant enough to fuss over. If each asset class is represented by an index fund similar to that asset class, then this pretend optimal mix is pretty much the same as a real optimization. The problem with that is that you can only find index funds for a little more than half of the asset classes in the Real World (and using ETFs offer little-to-no help here, because they behave more like mutual funds than index funds, plus they have much too little history for the results to be statistically significant). The worst end-result is that the optimizer has picked the asset allocation mix based on asset class historical data, while completely ignoring all personal characteristics of the client's life. In other words, one of the things asset class optimization does is determine the asset allocation mix. This is done a lot in real life because it's quick, cheap, and easy. Then something is actually telling an adviser what to do! Nothing else does that (except our turnkey money management systems). This rarely works out well, so this is the biggest reason why optimizers get bad press in the industry. For example, a novice advisor may give a moderately conservative investor a portfolio with way too much in equities because over some arbitrary time frame, the optimizer found a low-risk portfolio using several equity indices, and very little in bonds and cash. When this portfolio is brought out into the Real World, the investor may lose a lot of money in a short period of time, get mad, and close their account. This may happen all because one of the funds held 25% of its assets in cash during the optimized time horizon. Then the novice advisor tells everyone, "Optimizers are bad, I'll never use them ever again!" Optimizing at the asset level, and keeping the previously-calculated allocation as a constraint, solves most all of these problems. It does this mostly by using actual investments that real life investors can own. Most all stocks, mutual funds, ETFs, and variable annuity / life insurance subaccounts can be used. The program can then use each actual investment's historic rate of return, risk, and how it went up and down in relation to any other investment. The point here is that one needs to first calculate the "proper" mix of asset classes to use for an investor (based on their life factors), then input these constraints (using reasonable ranges) into the optimizer. Trouble easily finds one that performs this portfolio management strategy backwards, by letting the optimizer then choose the mix of asset classes beforehand. Some optimizers have tried to incorporate client life factors, like generic investment risk tolerance, into the program, and all this results in is a small range being highlighted in the efficient frontier. It's our opinion that this does not add anything of value, nor will programming advances enable an optimizer to calculate the "proper" mix of asset classes an actual investor should hold. This is the main reason why they are so dangerous. In our opinion, when this theory is tested in the Real World, it falls flat on its face about 75% of the time. We only optimized at the asset level, and we always used an asset allocation mix that was calculated in-advance of optimizing, specifically for each client as an optimizer constraint. This way the end result is an asset allocation mix that best fits the client�s life - which is more important than just finding portfolios with the highest amount of return for a given amount of risk (or vice-versa). The drawback is that it has a very long learning curve, is expensive, and it takes many times more time and work than pretend optimization. That's the difference in doing the work. Here are the differences in the results: • Optimizing using asset classes overstates diversification. Asset classes include many more securities than mutual funds. For example, the S&P 500 is an index made up of 500 stocks. Most growth stock mutual funds hold less than 75 stocks. Optimizing using the S&P 500 index to represent U.S. stocks, and then actually using a growth mutual fund (that owns 75 stocks) would result in much less diversification than the report stated. This is because the computer thought you were using an investment with 500 securities, when in real life, you bought an investment in its place with only 75 stocks. You have six to seven times less diversification in real life than the computer thought you had. Overstating diversification increases risk, and that's bad. Then the S&P 500 is also about 60% value and 40% growth stocks. Most growth mutual funds are 90% growth stocks. • Mutual funds can be selected that have a long-term history of outperforming their appropriate benchmark index or asset class. In other words, a good professional advisor can sometimes pick better investments to work with than generic asset classes or indices. • If a mutual fund has had risk and return that's way out of line with its asset class, you could be taking on a lot more risk than you thought you were taking. In every asset class, there is a wide range of investments to choose from. Some have a higher rate of return than the asset class, but also may have taken on much more risk. This is a dangerous thing to do with an asset class like bonds. The opposite is also a problem. Some small-cap stock funds have a lot less return and a lot less risk than the small-cap asset class / index. This is the asset class that's most likely to go through the roof in a bull market. You'll miss this boat by having a low-risk (low beta) mutual fund in this asset class. The only way to know for sure what you're getting is to optimize at the actual asset level, using that exact mutual fund's return data, because the optimizer will tend to choose the small-cap fund with the highest beta. • There are hundreds more actual investments than there are asset classes. Most low-end optimizers only have about half the asset classes needed to manage portfolio risk. • Asset classes are just averages of all of the actual investments in that asset class. The actual risk, return, and correlation properties of a real asset is usually much different than this average. These three sets of data are all the program uses to do the work. If you own a real asset that has a completely different set of data than the asset class, then you realize little benefit from optimizing. You're doing the simulation with an orange, then using an apple in real life. • Some advisors use the results of an optimization to establish the asset allocation. When an advisor optimizes at the asset class level, the result is a mix of asset classes that have shown efficient characteristics over some time frame. This would then be the asset allocation you would get in portfolios. As you've learned above (and on the main asset allocation page), we feel asset allocation mixes should be determined by the client's life situation, not by which combination of asset classes had the highest return over some arbitrary time horizon. We feel you should first create a personalized asset allocation and then optimize it. Optimizing at the asset class level is the exact opposite of this. Why You Don't Need Portfolio Optimization Software Now we're into the currently-written section that's worth reading, and will get to the bottom of this mystery. Why is it not worth spending a few grand annually on portfolio optimizers? It's not because it's very expensive, because investment advisers can usually afford investment software tools (plus it's a nice big tax deduction). It's not because of all of the bugs, software problems, lack of historical data, and program limitations that prevent you from doing what you need to do (these are ongoing frustrations even with the world's top investment software vendors that have been programming great products since the late 80's). It's not because it's almost impossible for "normal people" to learn how to use them correctly. Only "strange people" who are both computer and investment experts at the same time can do this. Most investment advisers are older salespeople with marginal computer skills. They excel in people skills, which us nerds don't have. They understand investment management, but can barely check their e-mail. Younger people with great computer skills, have just enough information in their heads about portfolio management to be dangerous. So it's rare to have an adequate level of both skill sets. If you're not an expert at both, then optimizers are nothing but trouble. Nor is it because it takes hundreds of hours to learn how to control it. Nor is it because most Broker Dealer Compliance people won't let you use them, because its improper use will just end up getting everyone involved into huge trouble, sooner or later. Nor is it because it's hard to explain the concepts to clients and prospects whose brains fill up and quit listening after a few minutes of boring investment management presentations. Nor is it because it takes from five to twenty hours to build a custom optimized investment portfolio per client. It's because asset class correlation coefficient numbers are too random. Two investments that have moved in opposite directions over the last ten years, could have moved in sync with each other over the last five years, or just one-year. Here's an image of correlations between the two elephants in the room - the S&P 500 and 10-year Treasuries. As you can see, they're all over the map over very short time frames. This is the bottom line of why portfolio optimizers don't work, should be avoided by everyone but teachers and students, and should be banned by Finra. You can download the image by right clicking on it.
This problem is compounded by optimizers that work at the asset level (e.g., mutual funds), because a mutual fund may change the way it does things quarterly (which instantly negates all of the past return data which the correlation coefficient numbers were based on). Just a new manager changes everything. Investment vehicle returns, and the resulting correlation coefficients, are event driven - so they change daily based on millions of people making investment trades based on how they react to the daily news. This means they can't be predicted, they change as the world economy changes, and they change dramatically when you change the benchmark slightly. If they were stable over time, then all of this would be the "Holy Grail of Investing," and something fascinating about correlation coefficients would be in the financial news every day. You never hear about it because it basically doesn't work and it's just not practical to use these days for managing money for clients in the Real World. That, and it's just too complex, and thus way too boring for our ADHD world. The bottom-line is that one can't really use correlation coefficients to forecast what's going to happen over any future time horizon. This is because they are long-term averages, which means you'll most always invest money right when there is the highest correlation, then you'll sell right before the low point in correlations. It's the same thing as saying that the S&P 500 has had an average of +10% annual return for the last 100 years, then watching it go down 20% as soon as you invest money, then up 20% as soon as you get out. Even if one holds on for the long-term, the correlations will not be the same as when you first invested. Here, you can read why old-hat sayings like, "The S&P 500 has had an average of +10% annual return for the last 100 years!" can completely stop working, which it has for most years so far in the 21st century. All of this empirical research is cool, and it's fascinating to see the numbers change over time, but whenever one tries to use them in the Real World, they rarely have the expected outcome. So if you're thinking that you have to be an expert at deciphering all of this calculus to get good investment portfolio returns, don't waste your time. You're just going to waste a lot of work, time, and money making a fuss about an investment strategy that works great as a concept, but completely fails when the details are applied in the Real World. You'll get all excited when you find something like Emerging Market Bonds having a correlation coefficient to the S&P 500 of -0.9 (near perfect negative correlation) over a recent time frame. Then as soon as you make the trades, both of these asset classes will go down 10% over the same week. It just doesn't work like it's supposed to in the Real World because the correlation coefficients change at random. Then just changing the time frame the portfolio optimizer worked with by a month or two results in portfolios that that are way too different from each other to even make sense. For example, one would expect only slightly different results if 120 months were used compared to 122 months or 118 months. But the differences are way too huge considering the tiny differences in time horizon. For example, the difference in 120 months vs. 122 months is 1.6%. One would then expect asset class mixes to change less than 1%. But in reality, they change about 5% to 8%. This was the tip-off that this whole thing was just an enormous exercise in futility. If you just grasp these basic asset allocation concepts, then apply them using a money management system that actually works well in the Real World of real investors investing their real money, then you'll probably do fine. If you try to construct an investment portfolio based on historical asset class correlation coefficients (using any time horizon), then you're just going to fail and end up losing lots of money. This is after spending lots of time, money, and work just trying to get this extremely complex software to do what you want it to do. You can calculate correlation coefficients between an investment and four benchmark indices by using the Portfolio Statistics sheet of the Asset Allocation Calculator for hardly any money (nor time spent learning it). When looking at the correlation coefficients between asset classes, they will vary depending on the time frame you select. If one were to determine a standard deviation for all of these numbers over a moving average of time horizons, one would get a range in which these numbers are stable. For example, if you took just three years worth of correlation coefficients between large-cap growth and real estate, you'd see a huge negative correlation in the first five years of the 21st century. Everyone was hiding their money in real estate because of perceived perpetual down-to-flat equity markets (which turned out to be correct). So as the S&P 500 has remained flat for going on a fifteen years, real estate has had one of its biggest Bull Markets ever (and then crashed more than ever since '07, while stocks mostly stayed flat). So let's say the covariance number over these five years was -0.5. If something were to happen today to make interest rates double, then both the S&P 500 and real estate would go down (because that's what happened for the last bazillion years). Let's say the correlation coefficient over this time frame is +0.5. Then after that, let's say interest rates went down, making both the S&P 500 and real estate go up, but the S&P 500 went up a lot, and real estate didn't near as much, so the number in this time frame is -0.25. Then add to that, the late 90's when stocks rallied and real estate fell. The sigma of the range of values in these three time frames would be ~0.75. That's way too much, and is an example of how you can get into big trouble by letting an optimizer run unconstrained. If you make a purely scientific bet based on the correlation coefficients between these two asset classes over the last five years, then the randomness of economic science (the art form part) will step in as soon as you make the trades, and you'll lose a ton of money - which is exactly what the portfolio optimizer is supposed to prevent. You just can't get an average correlation coefficient number over a long time horizon and expect things to move like that in the future. Any little thing will come along and will instantly negate all of the previous numbers - with the result being losing a lot of money. As they say, past performance is no indication of future performance. Anyone well-versed on the 20th century now knows this is very true. The point, and all one can do, is to know (from tinkering with a portfolio optimizer for many years) out of which of the dozens of asset classes that are available to invest in, which have correlation coefficients that are stable enough to use to manage client's money in the Real World. This is what we've done here in our asset allocation software and in our investment models. The short version is that to be able to perform asset allocation effectively (using correlation coefficients between asset classes as the main driving force), one must be able to distinguish the acceptable time frame ranges in which the correlation coefficients shift, have shifted, and probably will shift in the future. Since like all other facets of economic science, where most everything is event driven, and therefore random and unpredictable, this part of investment management is much more of an art form than an exact science. So if one allows the cold science of asset allocation to let a portfolio optimizer run unconstrained, then you're just begging to lose a lot of money in no time. For example, in most of 2001, the most efficient investment portfolio, given no constraints and the whole universe to work with, was 50% cash and 50% Microsoft stock. Nobody in their right mind would or should do that in the Real World, but that's what it recommended as the portfolio that will have both the least risk and highest return (Microsoft soon ended its period of historic double-digit annual gains and has been flat for many years, so that would have returned only a percent or so more than holding mostly all cash). Portfolio optimizers are like wild beasts that need to be tamed. And the only way to do that is look at it more like an art than a science, and the only way to get a "feel for it" is to use it correctly in the Real World when your butt is on the line because you're using its recommendations to make trades with client's life savings in the Real World. After a decade of that, you'll develop an instinct, which is most always contrary to the science. After you develop this instinct, then managing the ever-changing details becomes so overwhelming, that it's just not worth the trouble. It just doesn't work - and then guess what? Nobody has ever said any of this worked well in the Real World in the first place! Out of the dozens of asset classes that are available to invest in, most have unacceptable correlation coefficients ranges. So we limited the number of asset classes we work with to those that have 1) acceptable correlation coefficients ranges, 2) will make money, and 3) will reduce risk. Then we whittled them all down to about 21 - so we manage only 22 asset classes (and the last one is cash, which sort of is a default that doesn't count). This way we can watch to see over time, and various market environments, how to best take advantage of the random ranges of correlation coefficients between asset classes. This allows us to both maximize the good effects and minimize the bad effects of this randomness. This is where the art of portfolio management constrains the logical science. Over the years of tinkering with it, we have it down, and it hasn't changed much since 2004. The actual results are in the returns, which is the overall goal of investment management in a nutshell, and speak for itself. The only way we can see using a portfolio optimizer again, is if good aliens came in peace, a new era of interstellar trade was started, which resulted in several more previously-unheard of profitable asset classes being created to invest in. Just kidding, but that's just the magnitude of change that would be needed to make portfolio optimizers worthy of working with again these days. All of the asset classes we can imagine already have dozens of mutual funds and/or ETFs created to buy into them. So it's going to take something drastic to create new asset classes that are different enough to be useful in any way. Don't hold your breath for any of that! But guess what? A new potential asset class did emerge! So no new asset classes means there is little-to-nothing new that portfolio optimizers will have to work with that are of any interest to getting great low-risk investment returns that beat just about everything over long periods of time. Everything in the investment management industry has just been "done to death" so much now, that the only thing the brilliant "Wall Street innovators" can come up with, is basically repackaging the same only stocks and bonds into a different wrapper, and calling them something different - AKA ETFs and hedge funds. In summary, it's my stupid little opinion that portfolio optimizers should be banned by Finra when it comes to financial advisers building investment portfolios for individual investors. If it actually provided any value to investors in the Real World, then a huge fuss would have been made to make and sell the program here. It's fascinating and has its place in educating rookies on how things work, but it only provides massive amounts of negative value when applied in the Real World. I wish things were different, because I'd love it if I could get rich by fiddling with it all day for a living (which I did for over a decade, and that was great!). But it doesn't, so I didn't, and you shouldn't either. |
Financial Planning Software Modules For Sale (are listed below) Financial Planning Software that's Fully-Integrated Goals-Only "Financial Planning Software" Retirement Planning Software Menu: Something for Everyone Comprehensive Asset Allocation Software Model Portfolio Allocations with Historical Returns Monthly-updated ETF and Mutual Fund Picks DIY Investment Portfolio Benchmarking Program Financial Planning Fact Finders for Financial Planners Gathering Data from Clients Investment Policy Statement Software (IPS) Life Insurance Calculator (AKA Capital Needs Analysis Software) Bond Calculators for Duration, Convexity, YTM, Accretion, and Amortization Investment Software for Comparing the 27 Most Popular Methods of Investing Rental Real Estate Investing Software Net Worth Calculator (Balance Sheet Maker) and 75-year Net Worth Projector Financial Seminar Covering Retirement Planning and Investment Management Sales Tools for Financial Adviser Marketing Personal Budget Software and 75-year Cash Flow Projector TVM Financial Tools and Financial Calculators Our Unique Financial Services Buy or Sell a Financial Planning Practice Miscellaneous Pages of Interest Primer Tutorial to Learn the Basics of Financial Planning Software About the Department of Labor's New Fiduciary Rules Using Asset Allocation to Manage Money Download Brokerage Data into Spreadsheets How to Integrate Financial Planning Software Modules to Share Data CRM and Portfolio Management Software Calculating Your Investment Risk Tolerance |

© Copyright 1997 - 2018 Tools For Money, All Rights Reserved